A novel market sentiment measure: assessing the link between VIX and the Global Consciousness Projects data

Citation
Holmberg, U. (2023), "A novel market sentiment measure: assessing the link between VIX and the Global Consciousness Projects data", Journal of Economic Studies, Vol. ahead-of-print No. ahead-of-print. https://doi.org/10.1108/JES-11-2023-0663
Note: The results should not be interpreted as trading advice
Econometric models
A multiple linear regression model, i.e. a model in which the response variable is a linear combination of several predictor variables, a constant, and a random disturbance, is fitted on the daily S&P 500 index returns.
The returns are dependent on lagged returns, variance in returns, VIX as well as stock market index returns in different time zones. Trades in Asia are accounted for using the Japanese Nikkei 225 index and the Hong Kong Hang Seng index, while trades in Europe are accounted for using the Swedish OMXS30 index. By allowing for a slight overlap between trades made in Europe, the possibility that market sentiment is “reset” once markets open in the US is accounted for. The empirically observed Monday effect is accounted for by the inclusion of both an indicator variable equal to 1 on Mondays, as well as several interaction terms.
- The variables used can be found here.
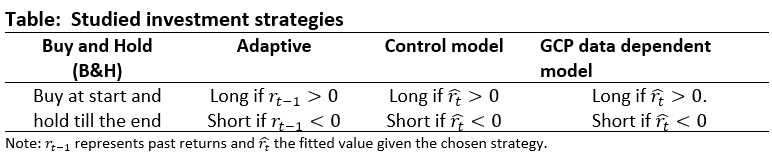
- The strategies used can be found here.
- The GCP data can be downloaded here.
- The models' parameters can be accessed here.
Send me an email if you need further details and/or additional decimals.
Brief description of the research project
-
- A statistical time series model is fitted on daily S&P 500 index returns.
- A version of the model that utilizes aquired correlation between GCP data aggregates and stock market returns is fitted.
-
- I perform out of sample simulations during one years’ time and aim to end the simulations on the 1st of August 2023.
- The hypothesis that the GCP data can be used to obtain excess returns is studied by comparing the funds relative performance and the funds"hit rate"
-
- The econometric models are estimated on data up to 2022-08-01
- On the 1st of February 2023 (i.e., after six months), the econometric models where disclosed.
- Since such information could affect the out of sample simulated returns (no arbitrage), the final econometric analysis will account for this possibility by comparing the two out of sample simulation periods.
How to interpret the results
- If the GCP data covaries with S&P 500 returns, the GCP data dependent virtual fund should outperform its GCP data independent counterpart.
- The "control" strategies, i.e., the passive buy & hold" (B&H) and the active “Adaptive” strategy, are depicted for comparison.
- Further details on the method and models used will be presented in an upcoming publication.
The virtual funds
- Virtual funds are set up and given an initial value of 100 on the 1st of August 2022.
- A day trading rule (long or short) is used for each fund
- The trade decision is based on of the one day ahead forecasted return is positive (long) or negative (short)
- The artificial contract is purchased at the indexes open price and sold at the indexes closing price.
- Since CET traded markets close 90 minutes after the New York stock exchange opens and since there is an intraday trending tendency towards the closing price, an adjusted fund development version is also presented. In the adjusted version, the artificial contract is purchased at the average of the indexes open and close price.
- The depicted simulation results are the funds simulated out of sample performance.
Comments (updated when needed)
Week 32 (2023)
Simulations adjusted using actual S&P 500 mini future price such
Week 31 (2023)
Simulations finalized on the 1st of August 2023. On the 3rd, they were also slightly modified after the file was quality checked ahead of writing an academic paper on the findings.
Week 30 (2023)
Simulation file recovered after a computer meltdown. Also, the simulations have been updated with information on closed markets.
Week 24 (2023)
During the Federal reserve decision week, the filtered approach presented was finalized and a version of the simulation that allows for trades during those weeks is presented. The GCP data filter is based on the likelihood of the observed GCP data and a filter is added on small values of Max[Z]. A decision rule is then used that tells the simulations to either use or to disregard the information contained in the GCP data. The effect of the filtering, as well as the inclusion of trades during federal reserved decision weeks, is presented without modifying the original simulation in four simulation variants in gallery.
Week 22 (2023)
The GCP data effect fund was meant to show that the drift parameter in the S&P 500 “random walk” changes if the daily “direction” is decided using a signal obtained from the GCP data. However, as a trade cost was included, the comparison with the S&P500 development was unnecessarily complicated and it has thus been removed.
Week 9 (2023)
In order to increase the interpretability of the figures, the B&H strategy is renamed to “S&P 500” as it reflects the index performance. The actively traded funds conditioned on the econometric estimates are relabelled as “With GCP data” and “Without GCP data”. Furthermore, the version excluding trades during the US Federal Reserve interest rate change weeks is thought of as the “base fund”. Dashed thus represents a version of the fund in which trades are made also during US Federal Reserve interest rate change weeks.
Week 7 (2023)
Both the GCP data model and its control delivered a weekly hit rate of 60%, resulting in a weekly growth of 0.4%. Both the hit rates and returns could possibly have been higher as the forecasted direction suddenly “went wrong” on the 16th after Cleveland Fed President Loretta Mester suggested that more interest rate hikes are to come in a virtual speech to a Global Interdependence Center conference.
Week 4 (2023)
The econometric models used were disclosed on the website.
Week 4 (2023)
Not all days on which no trade was made in the covarying markets had been adjusted for. The estimates now presented do so but as less trading days are used, total returns are slightly lower than previously announced.
Week 02 (2023)
Unsurprisingly, the actively traded funds simulated out of sample performance can be improved if consideration is taken also to local macroeconomic “surprise” effects (i.e., if published data is far from market expectations). One such example occurred when Swedish inflation came in higher than expected on the 13th of January, negativly affecting equity valuations. This effect is simply noted, as no change in the econometric models are allowed.
Week 52
It has been discovered that the simulations traded also on dates on which some markets (needed for the algorithmic trade decision) were closed (due to e.g., public holidays). As this could affect the simulated outcome (both with and without the GCP data), the depicted simulations have been mended such that they now represent the true out of sample fund performance. The original simulations are stored for reference.
Week 48
During the week, unpredictability was high resulting in an increase in the volatility in the fund’s relative performance. The simulation results also seem to suggest that the models (both with and without) does not fully capture the importance of inflation related macroeconomic data in the current macroeconomic environment. It is speculated that thus could be due to that the models are fitted on data outside of the ongoing interest rate hike cycle. Nevertheless, both the GCP data dependent fund and its GCP data invariant counterpart continued to outperform the market and the GCP data dependent fund maintains its high “hit rate”.
Week 44
Two comparison indexes are added (dotted) that illustrates the two funds (with and without GCP data) performance if the trader refrains from making trades during US Federal Reserve decision weeks.
Week 43
Due to the issues related with intraday price drifts, the used S&P 500 buy price has been reassessed. From now, only the reassessed simulations will be presented. Furthermore, the GCP data signal is depicted.
Week 42
During week 42, the control fund, for the first time since the simulations begun, outperformed the GCP data dependent fund. This since the GCP data signalled a slight decrease in the S&P 500 index on Friday, advising investors to go should short on the index.
The control fund model advised investors to go long which resulted in a very large daily return.
If the full intraday GCP data would have been used to inform which trade to make, the decision had been shifted towards going long. However, in order to be consistent with the previous trades the decision was made using sliced up intraday 15-minute chunks.
The historical data covering the period during the fourth week of August 2022 was briefly adjusted in October but after re-checking the data it was found that the original simulations were accurate and the funds previoiuse historical performance was restored.
Copyright ©
All rights reserved